The scientific basis of neurofeedback |
|
Our brains contain around 100 billion interconnected cells. When a change in voltage causes a chemical reaction in the brain, these cells interact in a sophisticated electro-chemical network. The electrical activity (commonly referred to as brainwaves) can be recorded and assessed using an electroencephalogram, or EEG. Different brainwaves are employed according to the task in hand. The healthy brain regulates its own activity appropriately, moving from one frequency to another as the task demands.
|
 |
|
Different brainwave frequencies in Hertz
|
|
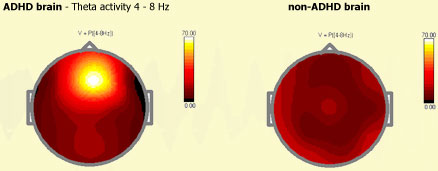
In the learning disabled brain, the appropriate frequencies are not called into use in the right area at the right time. For example, many children with ADHD have an EEG that reveals too much slow frequency activity in the pre-frontal cortex and dyslexic children typically show decreased activity in the left temporoparietal region (phonological dyslexia).
|
 |
|
This EEG shows excessive amounts of slow brainwave activity.
|
 |
|
These brain maps show the different activity in an ADHD brain compared with a non-ADHD brain
|
|
Frequently, children with learning difficulties have co-morbid attentional problems. Using the TOVA test, errors of omission &/or commission and slow and variable response times can be monitored. TOVA comparison graphs, below, show gains made after 20 sessions of neurofeedback.
|
 |
|
The TOVA test is a computerised continuous performance test. The graphs show pre- and post- scores on the 4 variables of attention for a pupil with dyslexia and attention (impulsivity) problems.
|
|
Since the 1960's, many scientific studies have confirmed the efficacy of neurofeedback. (Sterman, Lubar & Shouse, Gruzelier, Monastra, etc). See "Links" for a comprehensive bibliography of over 100 references in scientific journals.
|
